What our spring retention tests showed about sealing layers
A small set of local bake runs compared cells with and without a thin sealing layer. Some numbers behaved; others stayed noisy.
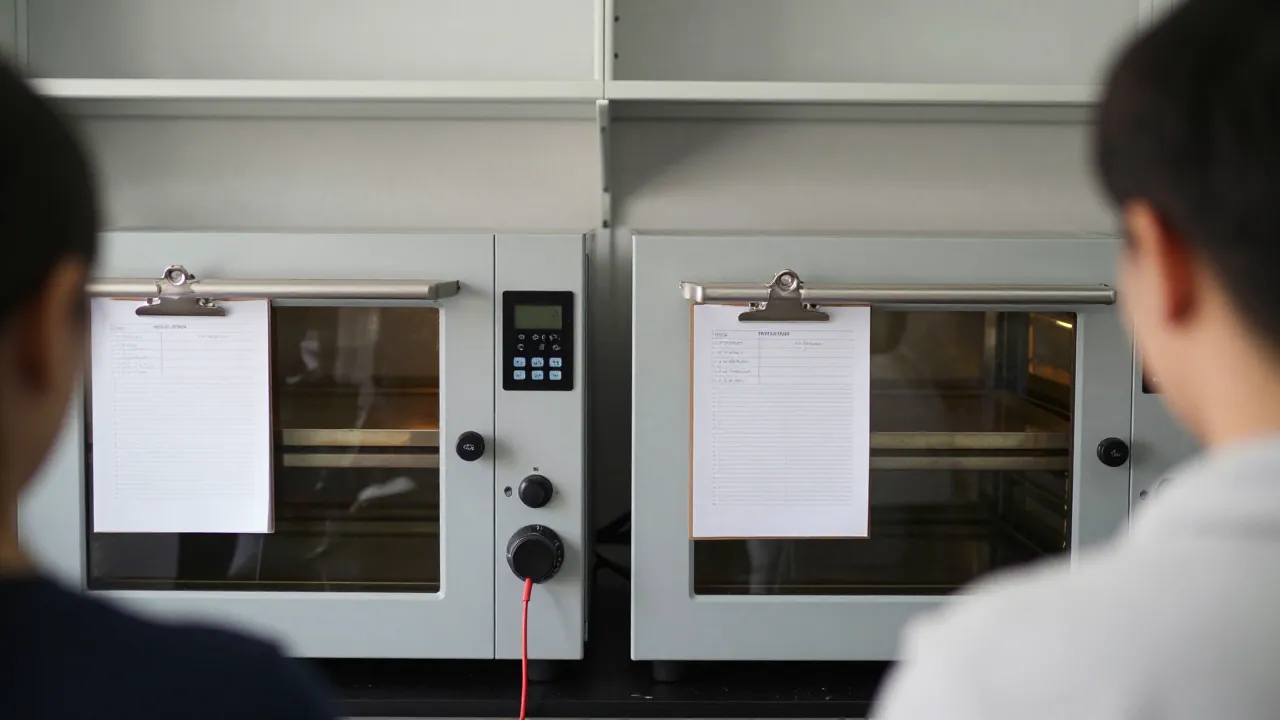
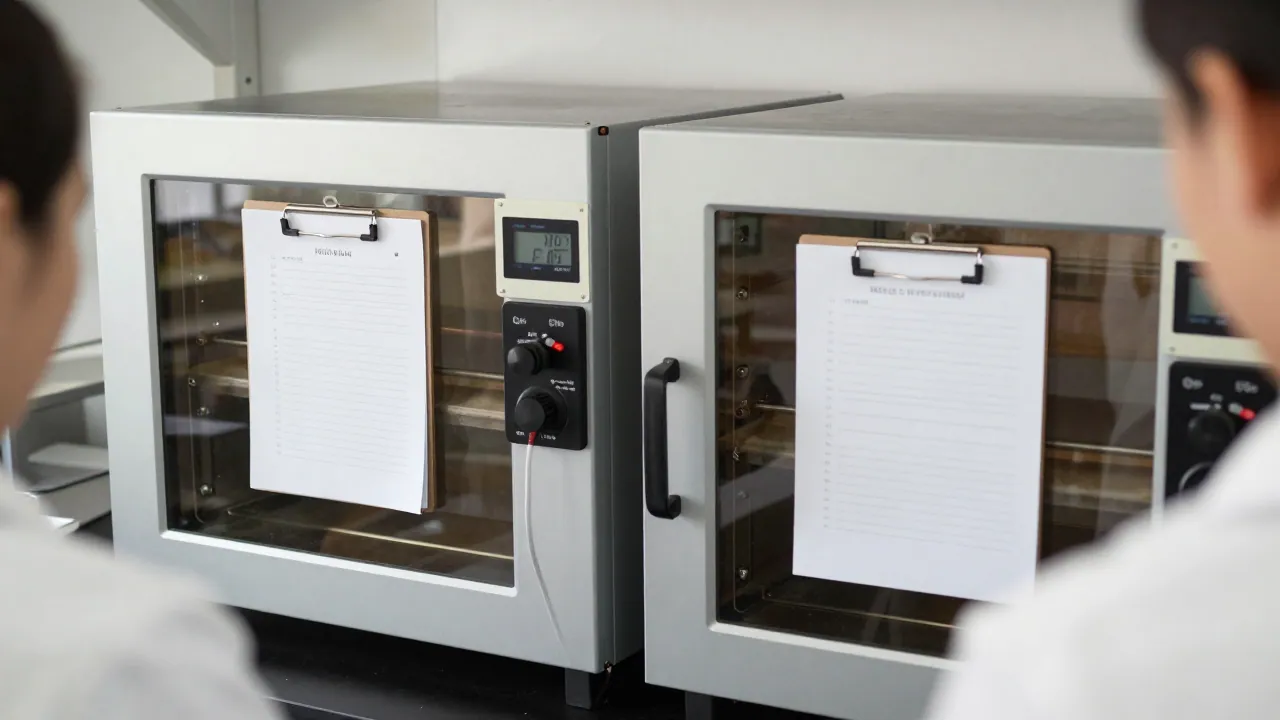
Between late March and mid-May we ran a limited set of retention bake tests on charge trap cells built with and without a thin sealing layer over the nitride. The plan was modest: four bake temperatures, two splits, and enough parts to see whether the sealing layer changes how charge leaves the trapping layer over time. We baked in two ovens, logged every step, and wrote down what we expected before opening the data. What we got is a partial answer. The sealing layer helped in the warm bakes and barely mattered at room temperature. Along the way we also learned where our test setup still leans on guesswork.
What we planned and what we actually built
The original plan was tidy. Two splits, one with a thin sealing layer and one without, drawn from the same wafer so most of the processing history would match. Four bake temperatures: room, 85 °C, 150 °C, and 200 °C. Eight parts per split per temperature, read at four points over the bake. That would have given us a clean comparison and a decent shot at a fitted slope.
We got most of it. The 200 °C arm ran short because two parts failed a contact check before the bake and we did not have spares from that lot. The 85 °C arm ran on a second lot after the first lot's parts were used up in an earlier cycling experiment. So the comparison is mostly within-lot, but not entirely, and we flag that wherever it matters.
Before we started, we wrote a short note on what result would count as a real difference and what would not. That was worth doing. It kept us from calling a 0.08 V shift a finding at the end of April. If you are setting up something similar, the habit is worth copying, and our notes on checking numbers twice cover the practical side of it.
What the bakes showed
The headline, stated carefully: in the 150 °C and 200 °C bakes, cells with the sealing layer lost less threshold voltage than cells without it, and the gap grew with bake time. At 200 °C the difference was clear after the first read at four hours and still clear at the last read. At 150 °C it took longer to separate but the direction held.
At room temperature and at 85 °C, the splits overlapped. Some reads favored the sealing layer, some favored the plain stack, and the spread between parts was wider than the difference between splits. We are not reporting an effect at those temperatures. It might be there and simply smaller than our sample can resolve.
| Bake temperature | Parts read (sealed / plain) | Median shift at last read | Read as |
|---|---|---|---|
| Room (~23 °C) | 8 / 7 | under 0.05 V both splits | no separation |
| 85 °C | 6 / 6 | 0.21 V / 0.24 V | inside noise |
| 150 °C | 8 / 7 | 0.38 V / 0.55 V | sealing layer ahead |
| 200 °C | 6 / 5 | 0.71 V / 1.12 V | clear separation |
Where the data is thin
Three honest caveats. First, the 200 °C arm lost parts, so five plain cells carried that row. Five is not a lot, and one outlier moves the median. Second, the 85 °C arm came from a different lot with a different wet clean. When we compared that lot against itself at 150 °C, the plain cells were also slightly worse than the first lot's plain cells, which points at the clean and not at the sealing layer.
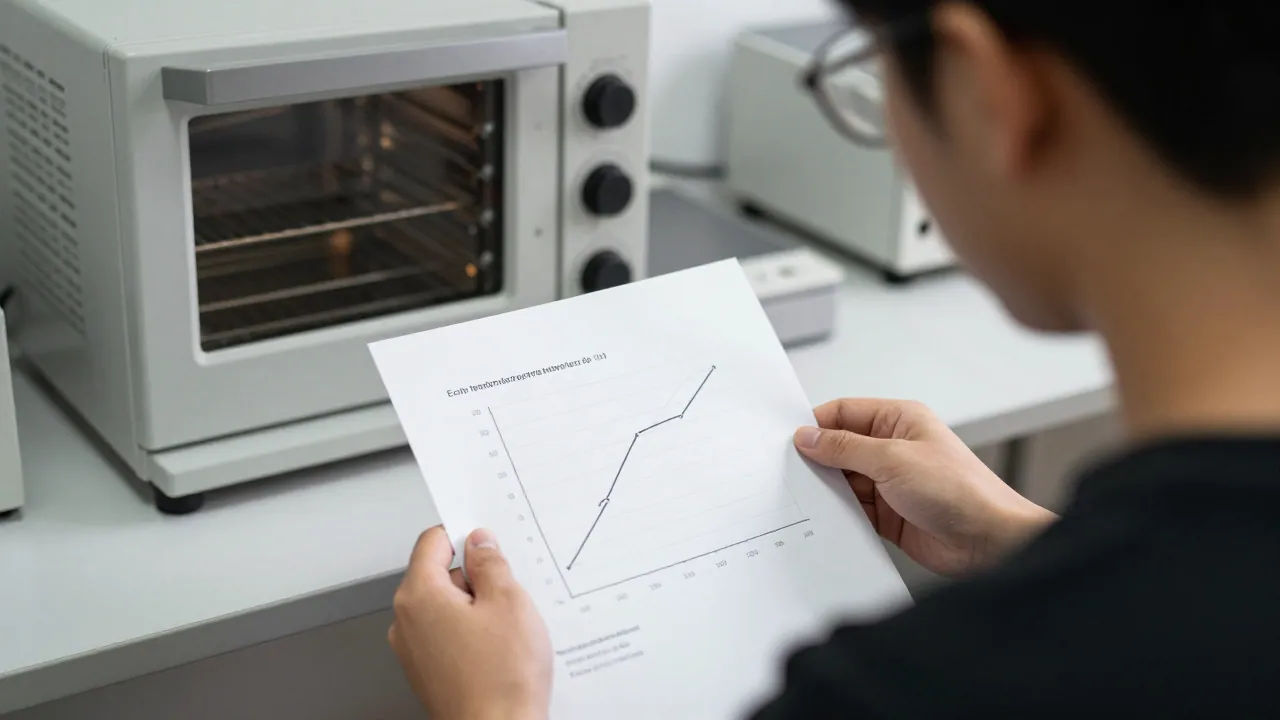
Third, we read threshold voltage at one point on the curve. That is a blunt instrument for trapping behavior. The retention curves we plotted look smooth enough, but we have not extracted trap energy depth from them yet. Our notes on reading retention curves describe the next step, and it is more work than we expected in March.
We also did not measure the sealing layer thickness directly on these parts. We are trusting the process record. If that record is off by a nanometer, some of what we are calling a sealing effect is really a thickness effect.
What did not go as expected
The room-temperature arm was supposed to be the easy control. It turned out to be the noisiest. Small differences in how long parts sat between the pre-bake read and the oven door opening produced shifts that were the same size as anything we hoped to see. We now read parts in a fixed order and log the time to the minute.
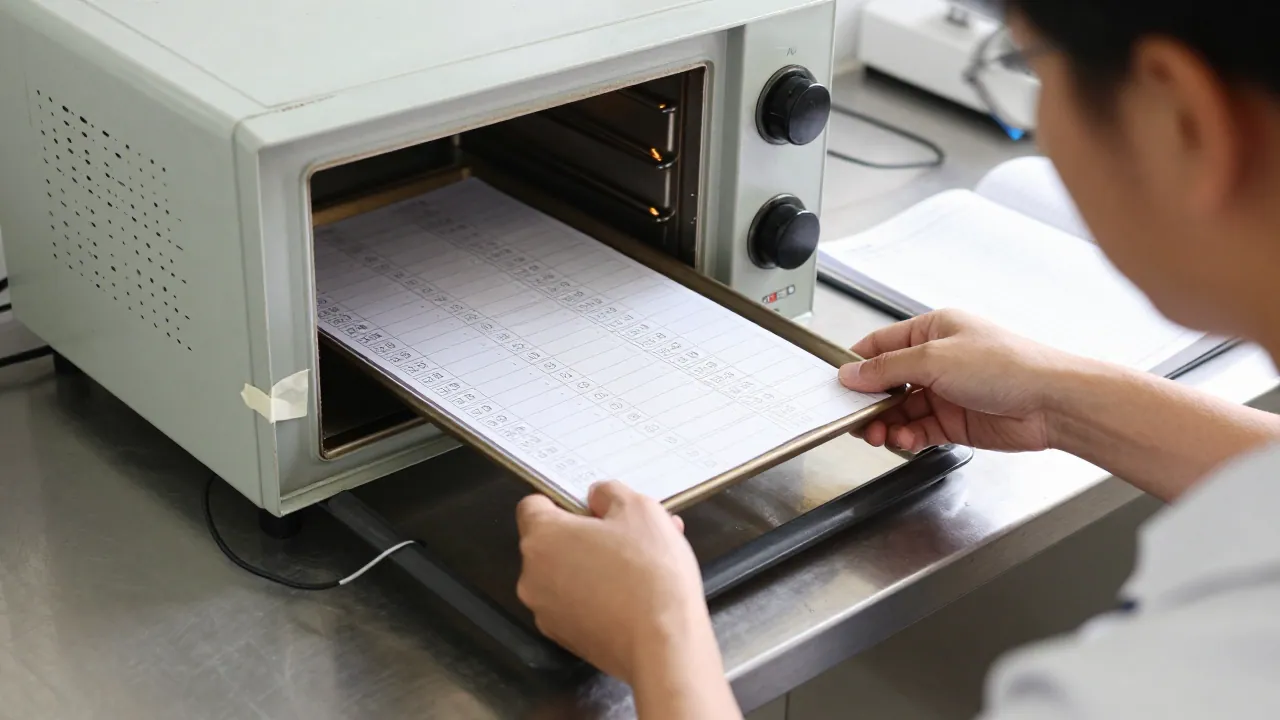
One run sheet went missing for a day. It turned up taped inside a notebook, which is exactly the kind of thing that makes a results post untrustworthy. We have moved to a single binder and a photo of each sheet at the end of the day.
The biggest surprise was how much the wet clean mattered. We expected the sealing layer to dominate. In our data it is one factor among several, and the clean is at least as visible. That shaped the plan for the next round more than the sealing result did.
The sealing layer is doing something in the hot bakes. Whether it is doing it for the reason we assumed is still open.
What we will change next
For the autumn round we will draw all splits from one lot, hold the wet clean fixed, and add a third split with a thicker sealing layer so we can separate thickness from presence. We will run 150 °C and 200 °C only, since those are where the signal lives, and put the saved parts into more reads per temperature. We will also log oven recovery time after each door opening, because that is a gap we have been waving at.
We will pre-register the analysis again, this time with a named person to check the table before it goes up. And we will bring the partial 200 °C result to the next online session for questions, since a room of people who have run these bakes will likely spot something we missed. If you want to follow along, the seminar schedule and the open notes are the places to start.
Questions people ask
Did the sealing layer improve retention?
In our 150 °C and 200 °C bakes it did, by a median of about 0.4 V at the last 200 °C read. At room temperature and 85 °C we saw no separation beyond noise, so the claim is limited to the hot bakes.
Why are the sample sizes so small?
We build parts in small batches on borrowed equipment, so eight per split is realistic. Small samples move easily, which is why we report medians, flag the lost parts, and avoid claiming effects that sit inside the spread.
Will you publish the raw data?
Yes, as a plain table of reads with run dates and lot codes, once the autumn round is finished and checked. We are not posting the spring numbers as a dataset because the missing run sheet and the mixed lots would make them misleading.